https://4th-down-prediction.com
I have deployed my Streamlit frontend and Fastapi backend to an AWS EC2 instance to demonstrate the models used in this project. Check it out with the link above!
Machine Learning Methodology:
Description
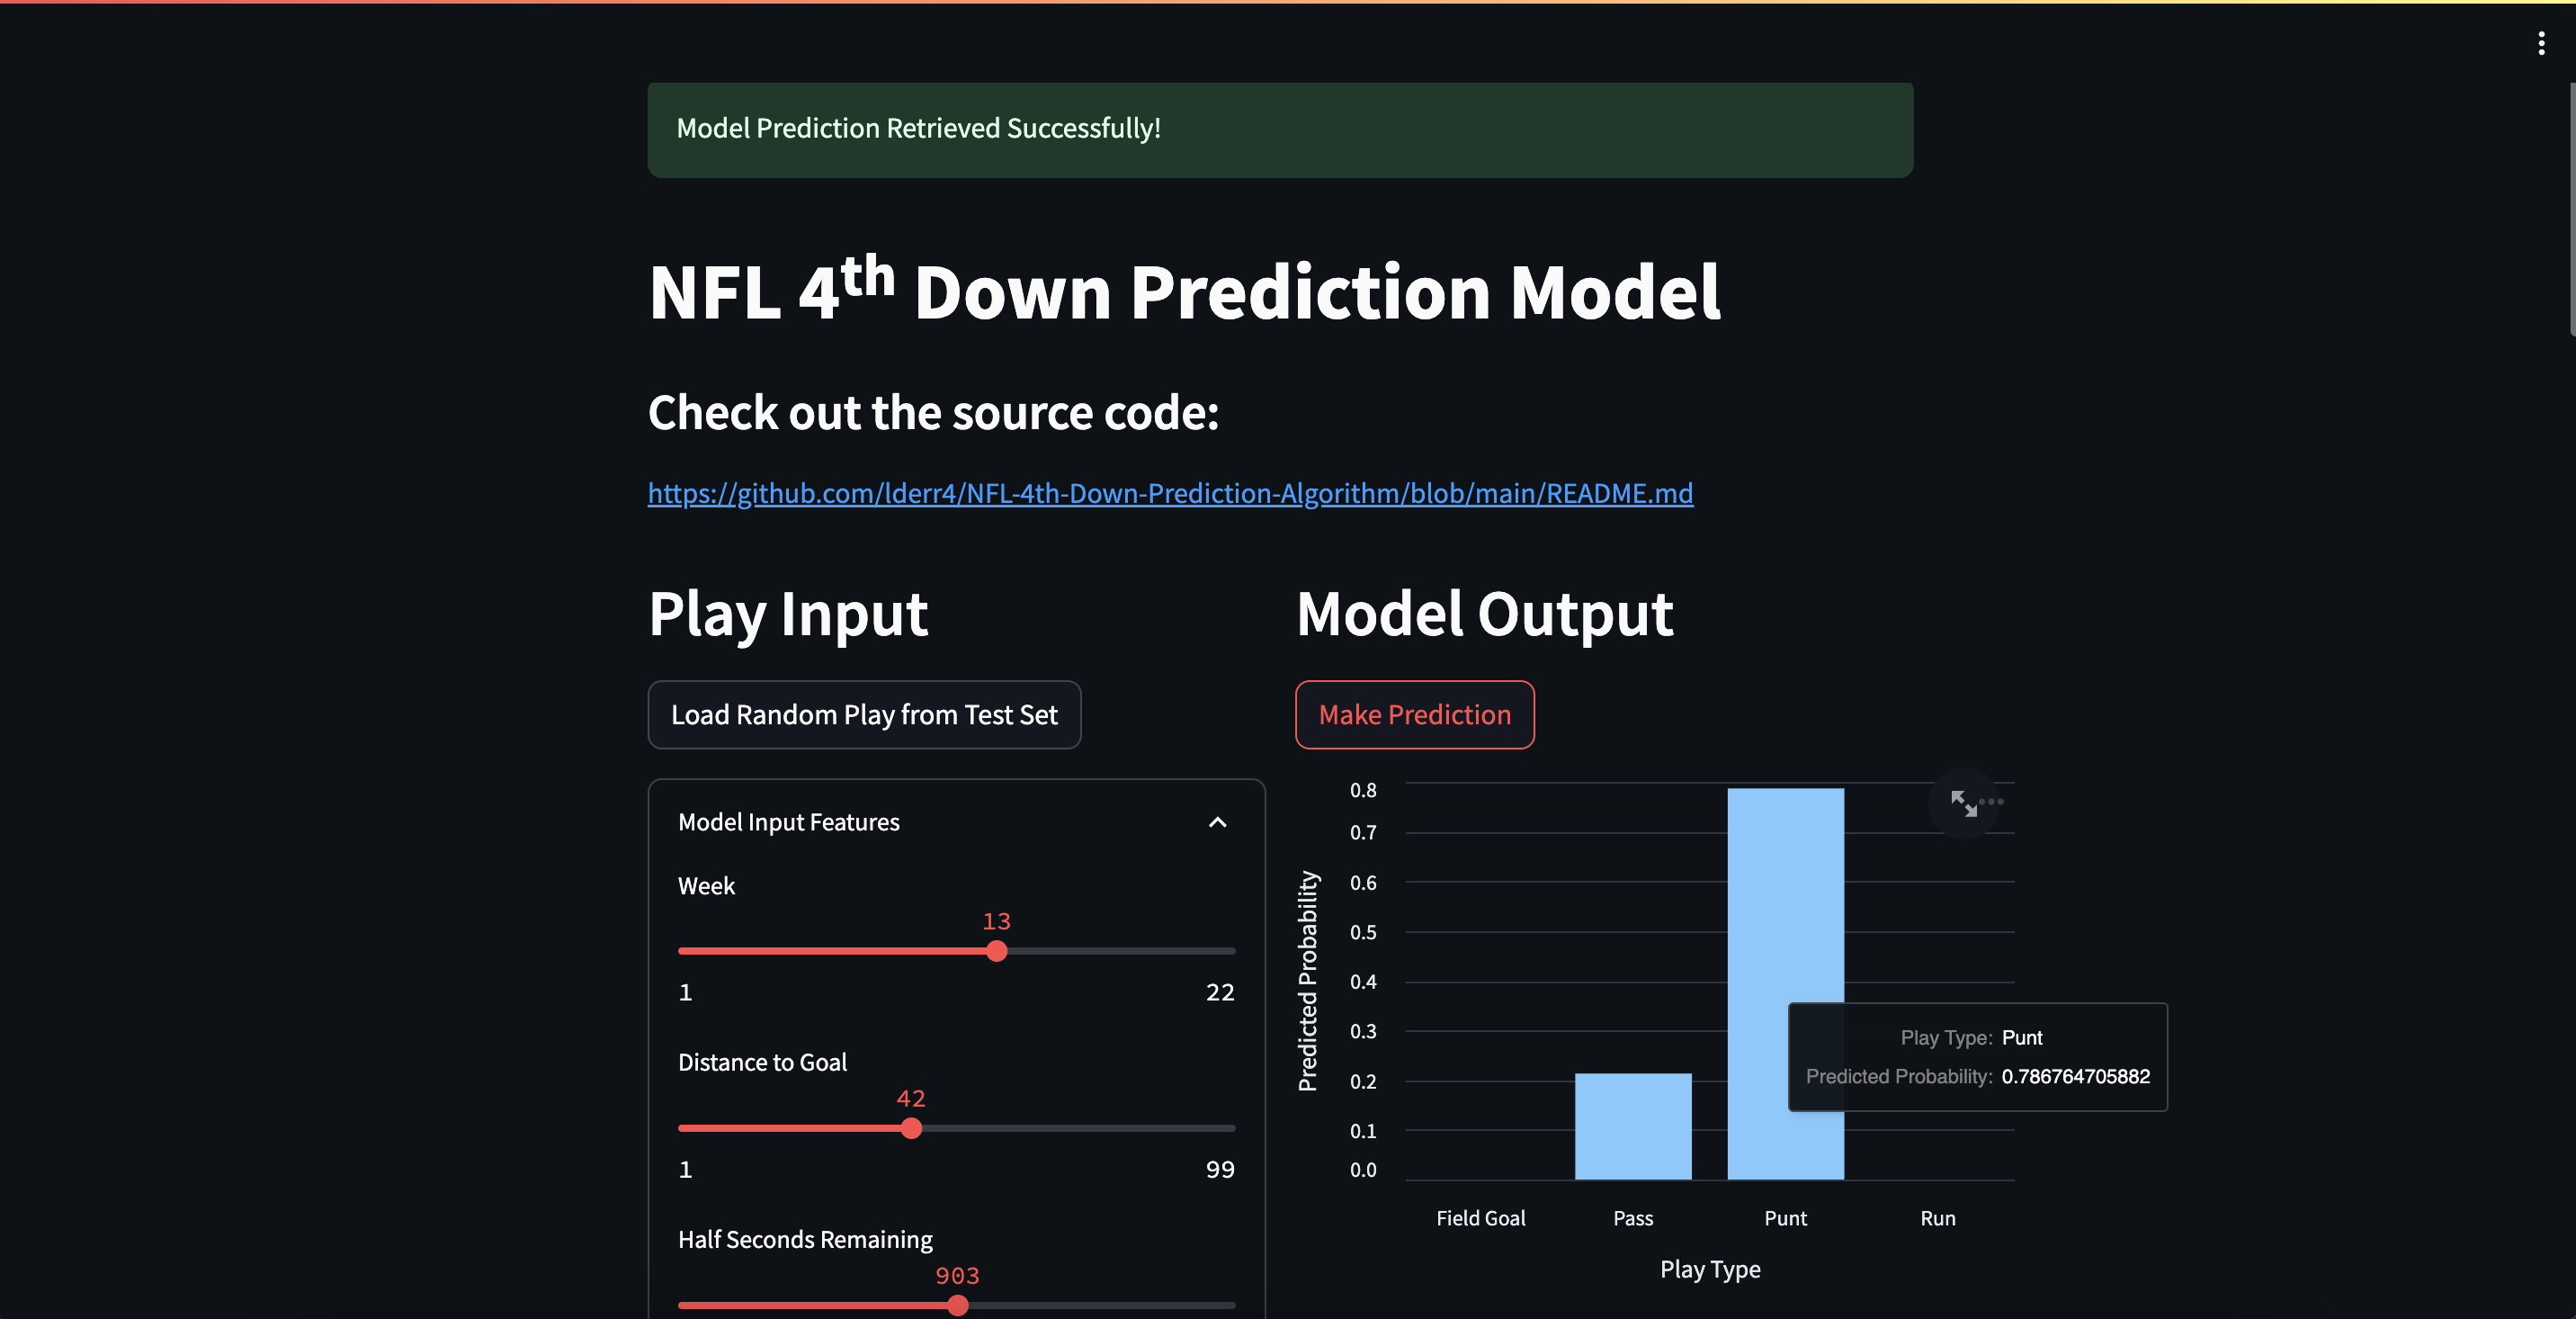
This project combines classification and regression tasks to determine whether a team should run, pass, punt, or kick a field goal on 4th down, emulating the duties of an NFL coach.
Dataset
All models are trained on the play-by-play dataset provided by the nfl-data-py API.
How it Works
This project combines 5 models: a classifier and 4 regressors. The classifier is a decision tree which can accurately assess situations as run, pass, field goal, or punt with 95% accuracy. This model is used for trivial decisions in which the right play is obvious. Less obvious plays are run through each of the relevent regression models to output a predicted win probability added (wpa). The model with the highest predicted wpa is the play that is used in the prediction.
How to run
# clone project
git clone https://github.com/lderr4/Robo-NFL-Coach.git

# Switch to project directory
cd Robo-NFL-Coach

# Setup Python3.8 Virtual Env
python3.8 -m venv env_name
source env_name/bin/activate
pip install -r requirements.txt

# Run the Training Script (which saves the Models, Dataset, and Class):
python3 robo_coach.py
Flowcharts
This section will give a deep dive into the technicalities of the project.
Model Training Flowchart

This diagram depicts the flow of data from the initial API request to the final loading of each model. Data is pulled from the nfl_data_py library. In total, five models are trained:
- Classifier: a multi-class Decision Tree Classifier which classifies fourth down plays as Pass, Run, Punt, or Field Goal.
- Pass Regressor: Predict the change in win probability (Win Probability Added) for Passing plays on 4th down
- Run Regressor: Predict the Win Probability Added for Run plays on 4th down
- Punt Regressor: Predict the Win Probability Added for Punt plays on 4th down
- Field Goal Regressor: Predict the Win Probability Added for Field Goal plays on 4th down
Predict Function Flowchart

This diagram illustrates the decision flow chart for the predict function of the robo coach class. The classifier’s predict_proba function is used to determine the degree of certainty of the prediction. If the probability of the highest play is above the max probability threshold parameter, the classifier will be used for the prediction. Otherwise, for each play probability that is greater than the minimum probability threshold parameter, the corresponding regression model is used to predict Win Probability Added. The play with the highest Win Probability Added is chosen.
Metrics and Plots
1. Features
1.1 Feature Correlation Heatmap
 Feature correlation was one of the feature selection techniques used in this project.
1.2 Feature vs Win Probability Added (wpa) Scatterplots

2. Classifier
2.1 Final Classifier Confusion Matrix On Test Set

2.2 Probability Distribution of predict_proba Function on Testset

2.3 Proportion of 4th Down Plays with a Play Exceeding Probability Threshold
 Notice the proportion of passing plays shooting up at about the 1% mark. This indicates lots of 4th down plays have ~1% probability of being a passing play. This is because of fake punts and trick plays which happen in typical punt or field goal situations.
3. Regressors
3.1 Run Regressor Metrics (Test)
| Metric | Score |
|---|---|
| $R^2$ | 0.525 |
| MSE | 0.00143 |
| MAE | 0.0257 |
| Correct Sign (+/-) % | 0.882 |
3.2 Run Regressor Plots

3.3 Pass Regressor Metrics (Test)
| Metric | Score |
|---|---|
| $R^2$ | 0.392 |
| MSE | 0.00275 |
| MAE | 0.0266 |
| Correct Sign (+/-) % | 0.865 |
3.4 Pass Regressor Plots

3.5 Field Goal Regressor Metrics (Test)
| Metric | Score |
|---|---|
| $R^2$ | -0.0573 |
| MSE | 0.00291 |
| MAE | 0.0247 |
| Correct Sign (+/-) % | 0.766 |
Note: Despite my best efforts, the field goal model still has a negative $R^2$, meaning simply predicting the mean would yield a lower $MSE$. This is because the outcome of a field goal is incredibly hard to predict, and is essentially random.
3.6 Field Regressor Plots

3.7 Punt Regressor Metrics (Test)
| Metric | Score |
|---|---|
| $R^2$ | 0.339 |
| MSE | 0.000908 |
| MAE | 0.0151 |
| Correct Sign (+/-) % | 0.742 |
3.8 Punt Regressor Plots

Results
This section will detail my analysis on the performance of the project.

This heat plot compares the model’s predictions with the actual NFL plays. As the maximum threshold decreases, the usage of the classifier (instead of the wpa regressors) increases, increasing the accuracy. Additionally, the minimum threshold parameter increases the accuracy of the regressors by eliminating plays which do not exceed it.